
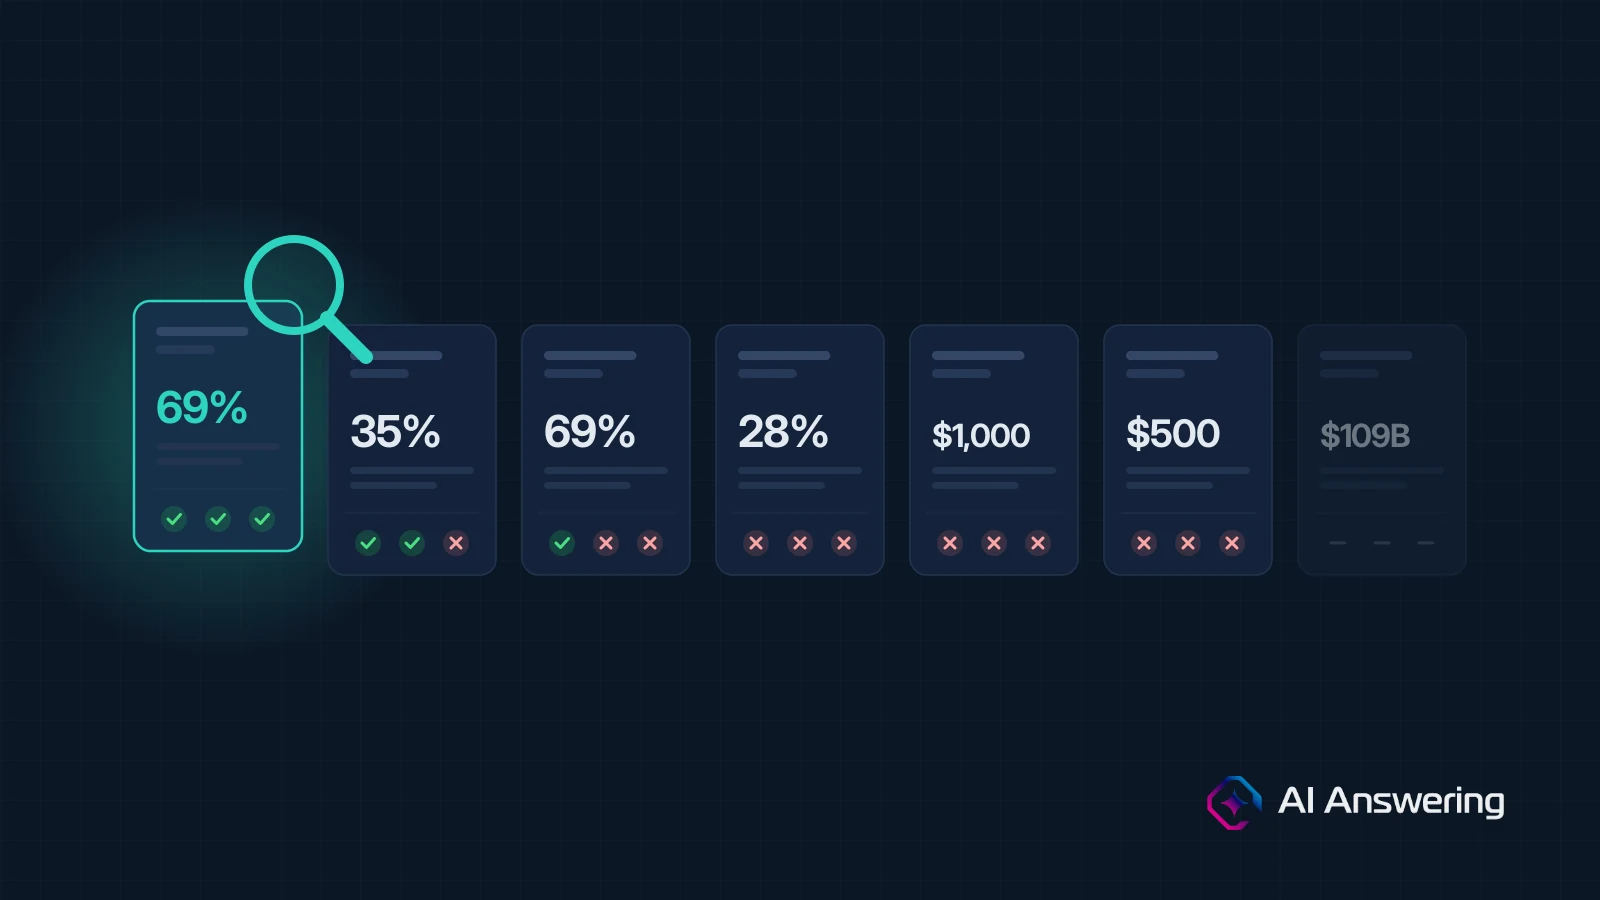
Seven widely cited pages put a price on missed business calls, and only one states the sample, time period and measurement behind its headline figure. This report shows what each one actually measured and what the numbers can support.
Key findings
- 1 of 7. Only one of the seven pages we audited states the sample size, time period and measurement definition behind its headline figure (Quo’s callback analysis of 16.7 million missed calls).
- 0 of 2. The “up to 85%” claim that missed callers won’t call back appears on two pages from the same publisher, and neither gives a source for it.
- 0 of 2. The “$109 billion” a year lost by law firms appears on two of the pages, and neither explains how it was calculated.
- $200 to $1,000+ vs. $200 to $500. One publisher prices a missed home-service call at two different ranges in two posts, with no method shown in either.
- +82%. In a worked example, moving the missed-call rate from the lowest published figure (22%) to the highest (40%) raises the estimated annual loss from $280,500 to $510,000, before any other input changes.
Every page in the audit is published by a company that sells phone, answering or intake products. That does not make the figures wrong. It means they should be treated as claims to check, and this report shows how.
How we did this
On 11 November 2026 we ran three US web searches: one on missed-call and voicemail statistics, one on law-firm missed calls, and one on home-services missed calls. We opened seven pages that gave a headline number on missed calls, voicemail behavior or the cost of a missed call. Six came from the search results; the seventh (CallRail) was opened because another audited page cited it for its main figure.
Three yes-or-no tests. For each page’s main data claim we asked:
- Is the sample size stated (calls, businesses or respondents)?
- Is the time period stated (when the data was collected)?
- Is the measurement defined (what counted as “missed”, “answered”, “callback”, or how a dollar value was calculated)?
A page scores 0 to 3. We scored only what the page itself says; if a page links to a fuller report that we did not open, the page is scored as it stands and we say so.
The audit: seven pages side by side
One page scores 3 out of 3, one scores 2, one scores 1, three score 0, and one is a compilation with no data of its own.
Two notes on the scores. First, Quo’s page scores 3 for its callback figure, but its separate claim that only 15% of callers leave a voicemail shows no method on that page. Second, a score of 0 means the page does not show its method, not that the figure is wrong; several of these pages link to fuller reports that we did not open.
What the audit shows
Five points stand out: figures that repeat without a source, one number used for two different things, claims that conflict, a headline total that rests on a hypothetical, and a single large dataset that measures callbacks rather than missed-call rates.
Figures repeat without a source
Both Signpost pages say that up to 85% of callers who can’t reach a business won’t try again, and neither names a source.
The “$109 billion” in annual law-firm losses appears in the Law Leaders release and on the Legal Soft page; the release gives no method, and Legal Soft attributes it to the Oklahoma Bar Association, a page we did not open.
One number, two meanings
“Fewer than 20%” appears on both Signpost pages. On the home-services page it describes voicemails that get a callback fast enough to keep the caller interested. On the contractors page it describes callers who leave a voicemail at all.
Claims conflict
Quo’s call logs show 15% of callers leave a voicemail. Moneypenny’s 2016 report says 69% of callers who reached voicemail hung up, which implies 31% left a message (our arithmetic, not Moneypenny’s wording).
The two use different customers and different years, so they are not a like-for-like comparison, but a reader would not know that from either page. Quo also cites a YouGov survey of UK consumers putting the figure at 6%; we did not open that survey.
A headline total rests on a hypothetical
CallRail’s “$7M annually” for law firms comes from a model of an imagined personal-injury firm with 80 leads a month and a $55,000 average settlement, not from measured losses.
The page also states the value per lead as $19,500 (“35% of $55,000”), when 35% of $55,000 is $19,250; the page’s monthly total matches the $19,250 figure.
The one large dataset is a callback study, not a missed-call rat
Quo’s 16.7 million logged missed calls show 69% got no business callback within 48 hours. Its callback rates by industry were 41% for healthcare, 33% for professional services, 22% for consumer goods and 21% for non-profits.
Quo’s page does not describe the mix of businesses in its customer base, so the figures describe Quo’s customers, not all businesses.
How much the missed-call rate alone moves the estimate
For the same law firm, the published range of missed-call rates changes the estimated annual loss by 82%, from $280,500 to $510,000. This table is our own calculation, not a measurement.
The model estimates revenue at risk in a year:
L(year) = 12 × C × m × (1 − r) × k × V
C is new-prospect calls per month, m is the share missed, r is the share of missed callers the firm still wins back, k is the close rate on answered calls, and V is the average value of a won client.
We held every input fixed at example values we chose, and changed only m. The example firm gets 100 new-prospect calls a month (C), wins back 15% of missed callers (r, a placeholder), closes 25% of answered calls (k) and earns $5,000 per client (V). That makes the expected value of one missed call $1,063.
The result moves in direct proportion to m, so a firm that quotes a single missed-call figure is choosing a point inside a range that wide before it adds any other assumption. The other inputs also move the result (k and V in direct proportion, r through the factor 1 − r), which is why we show a range and publish the formula rather than one number.
Ranges you can use, with a confidence rating
Only one published figure earns a “Medium” rating, and none earns “High”. The rating follows from the audit score: 3 of 3 is Medium (we cap it there because every source is a vendor and none is independent), 1 or 2 of 3 is Low, and 0 of 3 is Very low.
The gap this leaves is the missed-call rate itself. No audited page measured it with a stated definition across a stated set of businesses, and that is the number a dated, defined call test can supply.
What we are measuring next
We plan to fill the gap with our own call test, and we will publish the results as version 1.1 of this report. Nothing below is a result; it is the design we are committing to before any call is placed.
- Sample: 300–500 calls to businesses across selected industries and cities, with the list and selection method published.
- Time Windows: Business hours, lunch, evenings, and weekends, with an equal number of calls in each.
- Answered Definition: A person or the business’s own system answers and speaks within 30 seconds.
- Recording: No recordings unless legal counsel approves the script and state-specific consent rules.
- Reporting: Counts and rates for answered calls, voicemail, and no answer, broken down by time window and industry, including margin of error and minimum sample size per group.
- Published Data: Call script, counting rules, and anonymized call log.
- Unfavorable Results: Report all findings, including industries where most calls are answered.
This design is subject to legal review before the first call. If it changes, we will say what changed and why.
Limitations, corrections and disclosure
Limitations
- Seven pages is not a census. They came from three US web searches on one day, and we chose which pages to open, so the selection is not random.
- The scores reflect only what each page says. A publisher may hold a fuller method in a report we did not read.
- We did not open the original sources that these pages cite, including CallRail’s call insights report, Moneypenny’s full PDF, the Oklahoma Bar Association article, the YouGov survey, and the CallRail and Jobber surveys quoted by Quo. A figure traced to one of those could score differently.
- The page text was read by an AI research assistant. Quotes and numbers should be re-checked against the live pages before you cite them.
- The worked example uses inputs we chose. It shows how the model behaves, not what any real firm loses.
Corrections. If a publisher shows us a method we missed, we will change its score, mark the date and say what changed. Every change goes in the version log below.
Disclosure. aianswering.ai sells AI answering services, so we benefit if missed calls are taken seriously. We will publish our call-test method before its results and hold it to the same three tests we applied to others.